
RNAsnp Web Server: Predicting SNP effects on local RNA secondary structure
Input format
The web server requires an RNA sequence and SNP description as mandatory inputs. In addition, some other parameters are optionally required to fine tune the RNAsnp performance.
Sequence
The input sequence should be either in fasta format or linear sequence without any gaps. Here is the example for fasta formatted sequence,>gi|56682960|ref|NM_000146.3| Homo sapiens ferritin, light polypeptide (FTL), mRNA GCAGTTCGGCGGTCCCGCGGGTCTGTCTCTTGCTTCAACAGTGTTTGGACGGAACAGATCCGGGGACTCT CTTCCAGCCTCCGACCGCCCTCCGATTTCCTCTCCGCTTGCAACCTCCGGGACCATCTTCTCGGCCATCT CCTGCTTCTGGGACCTGCCAGCACCGTTTTTGTGGTTAGCTCCTTCTTGCCAACCAACCATGAGCTCCCA GATTCGTCAGAATTATTCCACCGACGTGGAGGCAGCCGTCAACAGCCTGGTCAATTTGTACCTGCAGGCC TCCTACACCTACCTCTCTCTGGGCTTCTATTTCGACCGCGATGATGTGGCTCTGGAAGGCGTGAGCCACT TCTTCCGCGAATTGGCCGAGGAGAAGCGCGAGGGCTACGAGCGTCTCCTGAAGATGCAAAACCAGCGTGG CGGCCGCGCTCTCTTCCAGGACATCAAGAAGCCAGCTGAAGATGAGTGGGGTAAAACCCCAGACGCCATG AAAGCTGCCATGGCCCTGGAGAAAAAGCTGAACCAGGCCCTTTTGGATCTTCATGCCCTGGGTTCTGCCC GCACGGACCCCCATCTCTGTGACTTCCTGGAGACTCACTTCCTAGATGAGGAAGTGAAGCTTATCAAGAA GATGGGTGACCACCTGACCAACCTCCACAGGCTGGGTGGCCCGGAGGCTGGGCTGGGCGAGTATCTCTTC GAAAGGCTCACTCTCAAGCACGACTAAGAGCCTTCTGAGCCCAGCGACTTCTGAAGGGCCCCTTGCAAAG TAATAGGGCTTCTGCCTAAGCCTCTCCCTCCAGCCAATAGGCAGCTTTCTTAACTATCCTAACAAGCCTT GGACCAAATGGAAATAAAGCTTTTTGATGCA
SNP
The SNP description is required in the format of XposY, where X is the wild-type nucleotide, Y is the mutant and pos is the position of nucleotide in the wild-type sequence. The position for first nucleotide in the sequence is 1.For example, the single SNP is described as,
T22Gwhere, 'T' is the wild-type nucleotide at position 22 that needs to be changed as 'G'.
In case of multiple SNPs, delimit them with the special character hypen "-",
T22G-G17CNote: The maximum distance between first and last SNP should be less than 10.
In case the user wants to check for different SNPs in a single run, then provide them in separate lines
T22G
T22G-G17C
If the genome database is selected as input source, then the input SNP should be prefixed with the chromosome name.
chr19:T49468587GThe effect of a known SNP with rsid can be tested with its information obtained from dbSNP. For example, the details of a SNP, rs11553244, obtained from dbSNP can be provided in the following format,
chr19:G49468642A
Note: At present the web server can't handle any insertion or deletion.
Mode of operation
- Mode 1: is designed to predict the effect of SNPs on short RNA sequences (< 1000nts), where the base pair probabilities of the wild-type and mutant RNA sequences are calculated using the global folding method RNAfold. The structural difference between wild-type and mutant is computed using Euclidean distance or Pearson correlation measure for all sequence intervals (or local region). Finally, the interval with maximum base pairing distance or minimum correlation coefficient and the corresponding p-value is reported.
- Mode 2: is designed to predict the effect of SNPs on large RNA sequence. Here, the base pair probabilities are calculated using the local folding method RNAplfold with the default parameters -W 200 and -L 120. As a first step, the structural difference is calculated using the Euclidean distance measure for all sequence intervals of fixed window length. In the second step, the sequence interval with maximum base pair distance is selected to re-compute the difference for all internal local intervals. The interval with maximum base pair distance and the corresponding p-value is reported.
- Mode 3 is the combination of modes 1 and 2 and it is designed to screen all possible structure-disruptive SNPs in an input sequence using a brute-force approach. First, Mode 2 is applied to evaluate the SNP effect for all possible substitutions at every nucleotide position. Secondly, the most significant SNPs (p-value < 0.1) are subjected to Mode 1 to re-compute the structure effect using a global folding approach. The SNPs which have significant local structural effect (p-value < 0.05) are finally reported.
Folding window
By default, RNAsnp considers a window of +/-200 nts around the SNP position to
generate the wild-type (WT) and mutant (MT) subsequences and computed their
respective base pair probability matrices in all the three modes.
This default value of 200nts can be changed between 100 and 800 (inclusive) in multiples
of 50 for Mode 1, and between 200 and 800 (inclusive) in multiples of 50 for
Mode 2 and 3. In order to achieve this, however, please make sure that the
input sequence is at least twice the size of chosen flanking. This restriction
is necessary to keep the size of parameter tables for the p-value calculations
manageable.
In case the input sequence is less than twice the size of chosen flanking, the
RNAsnp takes the nts up to the start and end position of the given sequence
from the SNP position and perform the analysis. However, in this case the
reporting p-value is not accurate since the input sequence length does not
match the sequence length available in the pre-computed parameter tables.
Additional options
Note: The pre-computed background scores, which RNAsnp uses to estimate p-value, are based on the default value assigned to the following parameters that are underlined. Thus, if the default value is changed for any of these parameters, then the reporting p-value is not accurate.| Parameters associated with mode 1 | |
|---|---|
| Measure | distance - the difference between the base pair probabilities of wild-type and mutant is computed using Euclidean base pair distance. This measure is very sensitive compared to correlation coefficient. correlation coefficient - the difference between the position wise base pair probabilities of wild-type and mutant is computed using Pearson correlation coefficient. |
| Minimum length of the sequence interval | The difference between the base pair probabilities of wild-type and mutant is computed for all local intervals which satisfy the given minimum length |
| Cut-off for the base pair probabilities | Base pair probabilities that are above this cut-off are only considered to compute the Euclidean distance or correlation coefficient between wild-type and mutant. |
| Parameters associated with mode 2 | |
| Average the pair probabilities over windows of size | This parameter is equivalent to -W of RNAplfold which is used to average pair probabilities over windows of size defined by the user (default: 200) |
| Maximum allowed base pair span | This parameter is equivalent to -L of RNAplfold which is used to restrict the long range base pairs. Thus it allow only pairs (i,j) with j-i <= span |
| Length of the local structural element that we expect to have an effect | This parameter defines the size of local region or length of the sequence interval considered for comparison |
| Length of the interval over which the local structural changes are evaluated | This parameter defines the maximum base pair span i.e., the bases within the selected local region can pair up to a distance of user defined value (default: 120) |
| Cut-off for the base pair probabilities | Base pair probabilities that are above this cut-off are only considered to compute the Euclidean distance between wild-type and mutant. |
| Parameters associated with mode 3 | |
| P-value threshold to filter SNPs that are predicted using Mode 2 | In the screening mode, RNAsnp test for the effect of all possible random mutation at each nucleotide position (Nx3) using mode 2. The SNPs which have p-value less than the given threshold is selected for further computation |
| P-value threshold to filter SNPs that are predicted using Mode 1 | The SNPs that are selected from the approximated screening mode 2 was then re-computed using mode 1 and finally the SNPs which have p-value less than given threshold are displayed as final output |
| Minimum length of flanking regions on either of SNP | In order to re-compute the structural effect using Mode 1, the local region which was identified in Mode 2 was used with some flanking regions around it. |
Output format
For all three modes of RNAsnp, the results are displayed under three main sections:
- Graphic summary
- Description
- Structure Details
Graphic summary
This section provides a graphical overview to see the location of the local region where the maximum structural change was detected. This local region is colored with respect to the following p-value scale 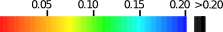 .
.
In the example figure given below, you can see the 'Query' line which represents the input sequence and the position of the SNP is highlighted in red vertical line. The line above the "Query" represents the local region which was identified with maximum structural change and it is colored with respect to the p-value color key. The link provided to the SNP U22G takes to the corresponding Structure Details section.
| Download |
Description
This section provides the details of RNAsnp execution, includes SNP tested, the region selected for folding (i.e the region around the SNP position), the detected local region, and its significance value in tabular format. If the user selected the input sequence from the genome database, a option to view the results at UCSC is provided in the last column of the table. The Download link below the table helps to download the results in csv format.| SNP | Folding Window | Local region | distance | p-value |
|---|---|---|---|---|
| U22G | 1-222 | 15-64 | 0.2482 | 0.0518 |
| Download |
Structure Details
This section provides detail about the structure of the local region and its base pair probabilities. The dot plot shows the base pair probabilities of the ensemble structures of wild-type and mutant RNA sequences corresponds to the predicted local region. The indices (i,j) of the matrix show a dot if the bases at position i and j form a base pair. The size of the dots is proportional to the base pairing probability where small dots indicate low and large dots indicate high probability to form a base pair (i,j). The upper triangle of the dot plot contains the base pair probabilities for the wild-type sequence and the lower triangle for the mutant sequence. The respective wild-type and mutant primary sequences are displayed on the sides of the triangle. For the mutant sequence, the SNP position is highlighted with a yellow box.
Below this dot plot for local region, you can find links to download the dot plot for global secondary structure. In that, the predicted local region is highlighted in gray background.
The dot plot can be downloaded as PS or PDF format. Also, the probabilities values can be downloaded in TXT format.
At last, the minimum free structures (MFE) of the global wild-type and mutant sequences are used to display the secondary structure in planar graphic representation. It is note that the MFE structure are only used for the representation, but not used for any calculation in RNAsnp program.