
Genome-wide identification of clusters of microRNA binding sites as microRNA sponge candidates
Annotation
GENCODE v19 and circBase are used to find annotations that overlap the sponge candidate coordinates (strand and position on chromosome).
Binding energy
The lower the binding energy is, the stronger the binding site. It is calculated based on simplified Turner energy model and uses a Smith–Waterman-like algorithm using a dinucleotide scoring matrix which approximates the Turner nearest-neighbor energies. In our study, −10 kcal/mol is energy cut-off for all binding sites. More detail please refer to RIsearch paper [1], our RIsearch2 [2] used in this study use suffix array to speed up RIsearch. And the parameter for RIsearch2 is
-s 1:8/6 -e -10 -w 5, the energy is calculated from whole miRNA sequence, and the miRNA seed region must have 6 base pairing.
Fraction of paired nucleotides
The fraction of paired nucleotides is defined as the number of base-pairings between the miRNA and its target site divided by the length of the mature miRNA. For example, if one miRNA has 17 base pairing nucleotides and the miRNA is 20 nt long, the base pairing ratio is 17/20=0.85. 1 means perfect matching between the whole miRNA and its target site.
SNP density
The seed and flanking regions are defined as follows: For one miRNA, it has multiple binding sites in sponge candidate region, and for every binding sites, the 7 nucleotides base pairing with miRNA seed region 2-8 is defined as miRNA seed region, the gap region between every two binding sites is defined as flanking region. For example, sponge candidate sequence is "CGAAAAAAATTTTTTTTTTTTAAAAAAATTTTTTTTTTTTAAAAAAAGGG", if "AAAAAAA" base pairing with one miRNA seed region, then it has 3 binding sites for that miRNA, the region between every two binding sites seed regions is flanking region (here is "TTTTTTTTTTTT"). The defined flanking region overlap the region base pairing with the miRNA mature sequence outside the miRNA seed.
The SNP density ratio (SDR) is calculated as the ratio between the SNP density in the miRNA seed region and flanking regions.
SNP density = (number of SNPs)/(number of nucleotides)
SNP density ratio = (SNP density in miRNA seed region)/(SNP density in flanking region)
The lower means the fewer SNP density in miRNA seed region than in flanking region. Where the SNP data with coordinate information on genome is downloaded from Ensemble.
Accessibility
The accessibility profile consists of scores for every nucleotiode which reflect its probability to be unpaired within the final internal structure. They are calculated by RNAplfold with window size 170 nt and maximum pairing distance 120. Accessibility values range from 0 to 1; the higher the value, the more accessibile this nucleotide is for binding.
Fraction of binding sites within exon
It is of high relevance whether the predicted binding sites are intronic or exonic, so here we calculate the fraction of binding sites within exons based on annotation from Gencode v19.
Fraction of binding sites within exon = (# of binding sites within exon)/(# of binding sites within sponge candidate region)
The higher the value is, the stronger binding sites overlap with exon.
Conservation
Conservation is the mean conservation score within sponge candidate based on phyloP (phylogenetic p-values) conservation score.
Overlap with conserved cluster
We keep those binding sites whose conservation score from phyloP score corresponding to miRNA seed region (2-8) have at least five continuous nucleotides greater than 0.3, then we run MCL clustering against those conserved binding sites. Compared to target clusters from all binding sites, if we still can get those target clusters from conserved binding sites, we will consider this sponge candidate is conserved.
Cluster size cutoff
We fit the size distribution of the top-10% largest clusters obtained for each miRNA in question on the randomized genome, assuming an exponential tail. Then we extrapolate the largest cluster one would expect to observe in 1000 randomizations as cluster size cutoff.
Only clusters larger than or equal to this cutoff are considered statistically significant.
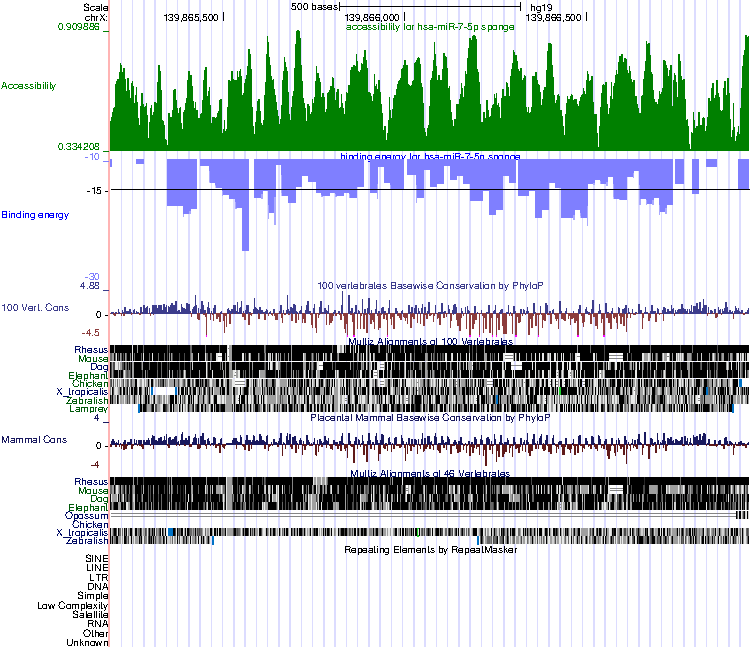
UCSC browser example
In Accessibility track, accessibility value is calculated by RNAplfold, the higher the value, the more accessibile this nucletide is for binding.
In Binding energy track, every bar is a miRNA binding site, for example, the sponge canddiate has 77 miRNA binding sites from RIsearch2, then it shows 77 bars in the following figures. the scale is binding site's energy. The smaller the binding energy is, the strong the binding site is.
the other 3 tracks are Conservation, Cons 46-Way and RepeatMasker track, which can be configured in UCSC browser.
More detail you can click the “View in UCSC browser” button and check it in UCSC browser.
RIsearch
[1] RIsearch: fast RNA–RNA interaction search using a simplified nearest-neighbor energy model
Wenzel A, Akbaşli E, Gorodkin J
Bioinformatics. 2012 Nov 1;28(21):2738-46. Epub 2012 Aug 24
[ PubMed | Paper | Software ]
[2] RIsearch2: suffix array-based large-scale prediction of RNA–RNA interactions and siRNA off-targets
Alkan F, Wenzel A, Palasca O, Kerpedjiev P, Rudebeck A, Stadler PF, Hofacker IL, Gorodkin J
Nucleic Acids Res. 2017 May 5;45(8):e60
[ PubMed | Paper | Software ]
Contact:
Xiaoyong PanJan Gorodkin
Lars Juhl Jensen